

Sun, 1. June 2014
Climate Change Update


"This figure shows how annual average temperatures worldwide have changed since 1901. Surface data come from a combined set of land-based weather stations and sea surface temperature measurements. Satellite measurements cover the lower troposphere, which is the lowest level of the Earth’s atmosphere. “UAH” and “RSS” represent two different methods of analyzing the original satellite measurements. This graph uses the 1901–2000 average as a baseline for depicting change. Choosing a different baseline period would not change the shape of the data over time."
It doesn't matter which way you look at this, the average global temperature is rising.
Why is it rising?
Scientists know that increasing the concentration of carbon dioxide, methane and nitrous oxide in the atmosphere serves to retain heat which otherwise would radiate away from the planet.
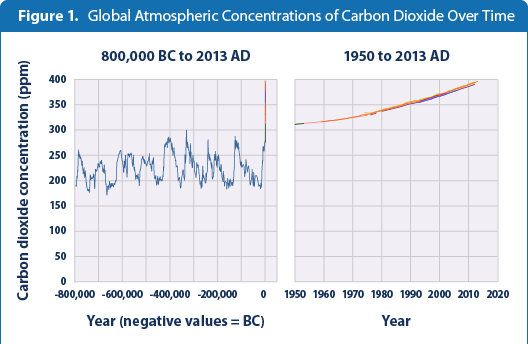
"This figure shows concentrations of carbon dioxide in the atmosphere from hundreds of thousands of years ago through 2013, measured in parts per million (ppm). The data come from a variety of historical ice core studies and recent air monitoring sites around the world. Each line represents a different data source."
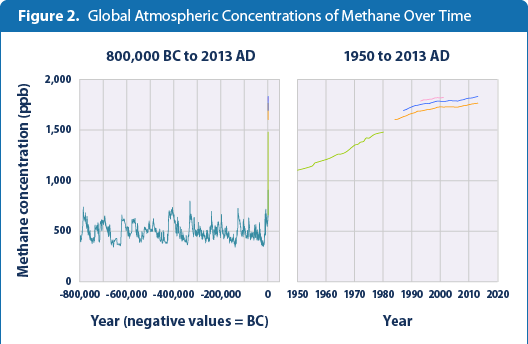
"This figure shows concentrations of methane in the atmosphere from hundreds of thousands of years ago through 2013, measured in parts per billion (ppb). The data come from a variety of historical ice core studies and recent air monitoring sites around the world. Each line represents a different data source."
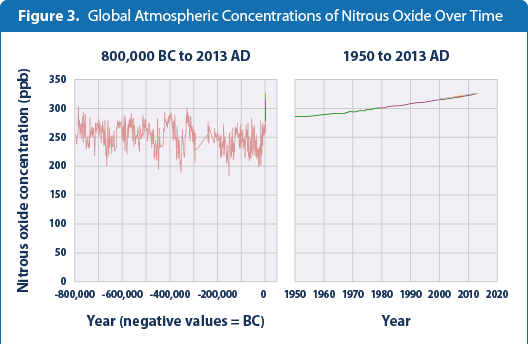
"This figure shows concentrations of nitrous oxide in the atmosphere from hundreds of thousands of years ago through 2013, measured in parts per billion (ppb). The data come from a variety of historical ice core studies and recent air monitoring sites around the world. Each line represents a different data source."
The correlation between the rise in average global temperature and the sharp rise of these three greenhouse gases should be blindingly obvious to anyone.
----------------------------------------------------------------------------
Data source (temperature): http://www.epa.gov/climatechange/science/indicators/weather-climate/temperature.html
Data source (Greenhouse gases): http://www.epa.gov/climatechange/science/indicators/ghg/ghg-concentrations.html

