

Tue, 26. February 2013
Greenhouse Gas Latest

We are losing the battle.
The latest greenhous gas measurements from CSIRO's Cape Grim monitoring station in Tasmania continue to show a linear upward trend and it is clear the world's leaders are not doing enough to contain a problem that has already been responsible for increases in the global average temperature.
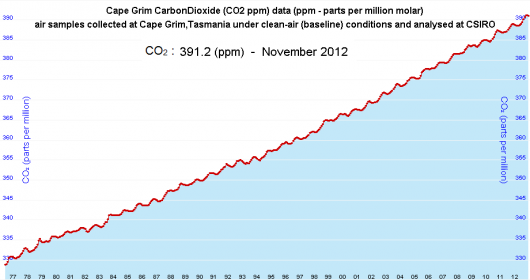
The following table shows the the November measurements for 2002, 2011 and 2012, compared with pre-industrial era:
| Greenhouse Gas |
Pre-Industrial Era |
Nov. 2002 |
Nov. 2011 |
Nov. 2012 |
| Carbon Dioxide CO2 | 278 ppm | 371.79 | 388.94 | 391.17 |
| Methane CH4 | 700 ppb | 1737.79 | 1766.70 | 1771.49 |
| Nitrous Oxide N2O | 270 ppb | 316.18 | 323.77 | 324.80 |
I can see an upward trend in concentrations.
You can see an upward trend in concentrations.
All the politicians worry about is a downward trend in votes. Sooner or later they will have to face up to the climate change issue. What sort of a world climate are we creating for our grandchildren?
Comments
Display comments as
(Linear | Threaded)
The author does not allow comments to this entry

